Effects of Location and Deprivation Deserts on Human Health
CSE6242 Team 141 Final Project
Brinda Bhatt, Emily Micciche, Chaky Muankaew, Amy Warner, and William Watson
X
This project focused on analyzing the effects of deprivation deserts (areas with low access to food, physical activity, public transport, education and houses of worship) on a variety of health outcomes in five cities (Atlanta, Cincinnati, Houston, New York, San Francisco, and Seattle).
Mapping data was collected from OpenStreetMap and matched to speed data from UberMovement as applicable. A variety of features was pulled from the maps related to each of the deserts (for instance, supermakets for food deserts), and continuous access measures were then calculated. Health outcome data was downloaded from the Census Bureau and advanced regression analysis was performed to find the most important access factors for each health response.
The visualization consists of several key components:
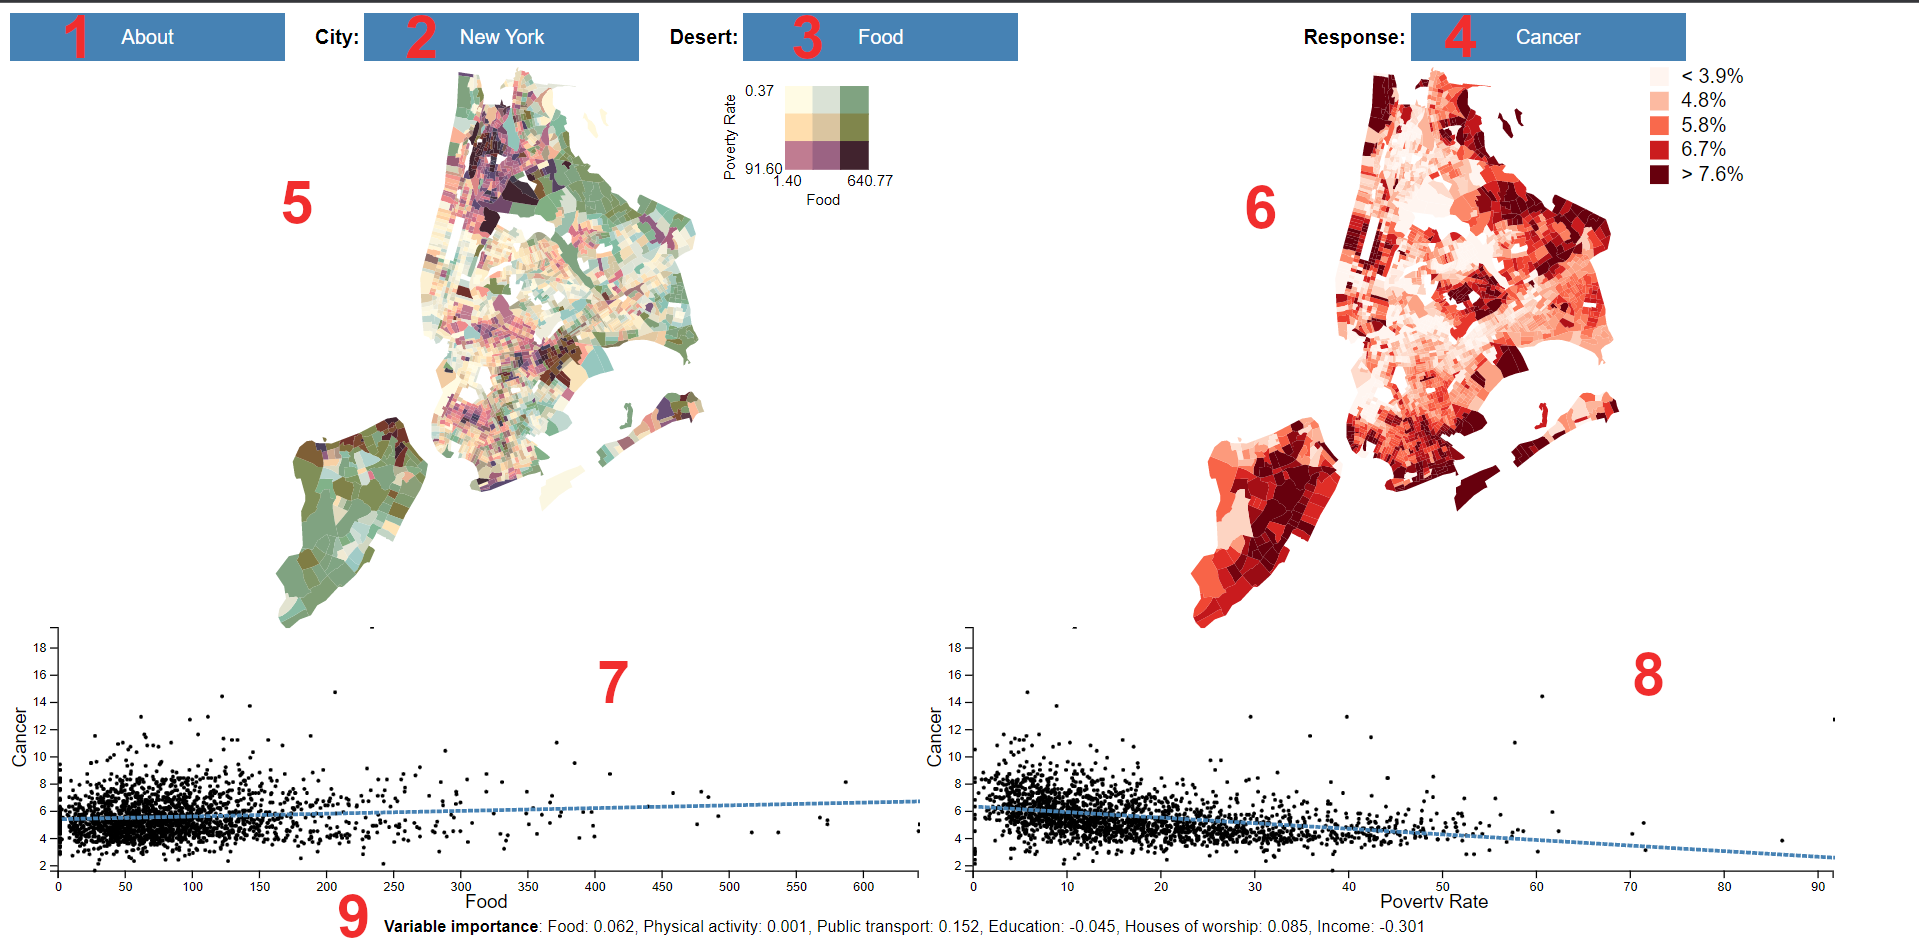
- Opens this popup
- Choose the city to view the data for: Atlanta, Cincinnati, Houston, New York, San Francisco, and Seattle
- Choose the access measure to display in the left choropleth: food, physical activity, public transport, education, or house-of-worship
- Choose the health respone to display in the right choropleth
- Bivariate choropleth of the selected city, with the parameters being the poverty rate and the selected access measure; hover to see more information
- Univariate choropleth of the selected city, with the parameter being the selected health response; hover to see more information
- Scatter plot of the selected access measure vs the selected health measure with a simple linear regression line to indicate general trend
- Scatter plot of poverty rate vs the selected health measure with a simple linear regression line to indicate general trend
- Variable importance as determined by our analysis, with sign indicating the direction of the relationship (i.e. negative for inverse)